
Non-Invasive Collection
The Smart Sticker® vs D-squame®
Epidermal sampling with the Smart Sticker was compared to the D-squame disk by measuring the epidermal tissue content on the tapes, levels of induced erythema, and the quantity of extracted nucleic acids and proteins. While having a smaller adhesive surface, four Smart Stickers lifted significantly higher amounts of tissue per tape, and yielded more nucleic acids per cm2, when compared to four D-squame sampling discs. Additionally, lower levels of erythema were evident when stripping with the Smart Sticker.
Figures
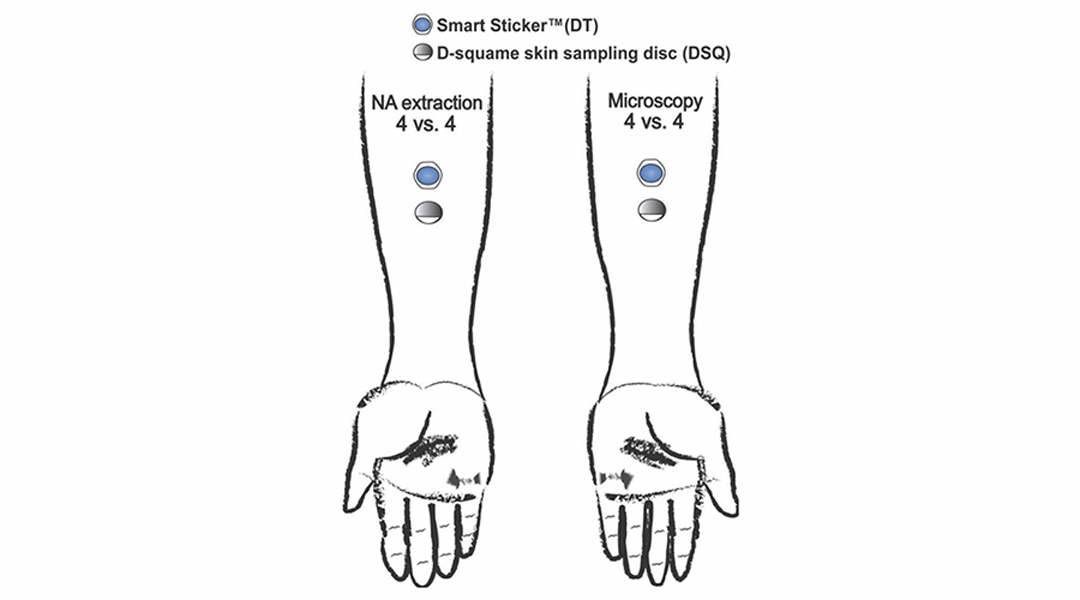
Figure 1. Tape placement on target skin
Samples collected with the Smart Sticker or D-squame skin sampling discs were analyzed by microscopy and nucleic acid (NA) extraction and quantification.
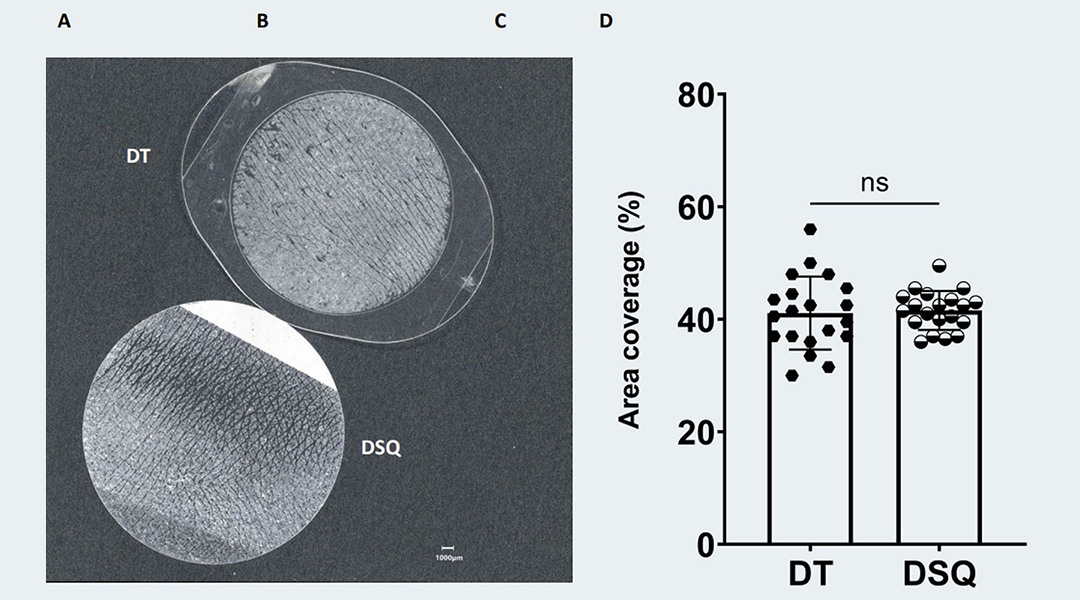
Figure 2. Epidermal tissue content on Smart Sticker (DT) and D-squame (DSQ) tapes
A. Adhesive area coverage with skin tissue after tape-stripping with the Smart Sticker (DermTech-DT) and D-squame skin sampling disc (CuDerm-DSQ). Adhesive area measures 2.8cm2 for the SmartSticker and 3.5cm2 for the D-squame disc.
B. Quantification of the percent tape area covered by tissue after sampling. Graph shows combined data for the 1st and 4th tape.
C. Representative image of the tissue amount on each type of adhesive tape. The indicated GB color scale reflects tissue height in um.
D. Quantification of the whole tissue amount per tape by color profiling. Graph shows combined data for the 1st and 4th tape.
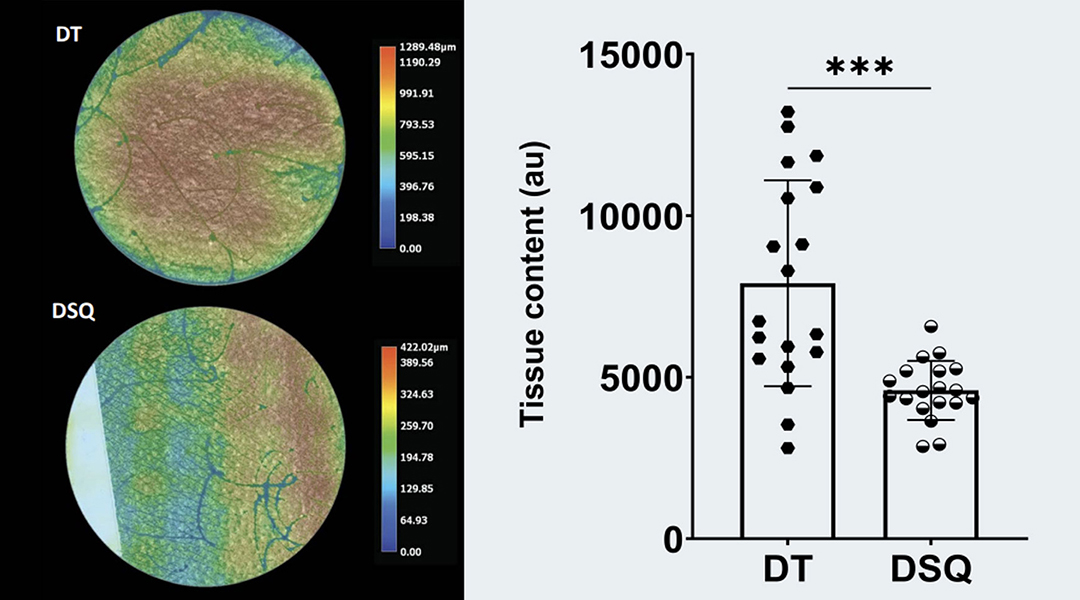
Figure 2 (continued). Epidermal tissue content on Smart Sticker (DT) and D-squame (DSQ) tapes
Figure 2. Epidermal tissue content on Smart Sticker (DT) and D-squame (DSQ) tapes
A. Adhesive area coverage with skin tissue after tape-stripping with the Smart Sticker (DermTech-DT) and D-squame skin sampling disc (CuDerm-DSQ). Adhesive area measures 2.8cm2 for the SmartSticker and 3.5cm2 for the D-squame disc.
B. Quantification of the percent tape area covered by tissue after sampling. Graph shows combined data for the 1st and 4th tape.
C. Representative image of the tissue amount on each type of adhesive tape. The indicated GB color scale reflects tissue height in um.
D. Quantification of the whole tissue amount per tape by color profiling. Graph shows combined data for the 1st and 4th tape.
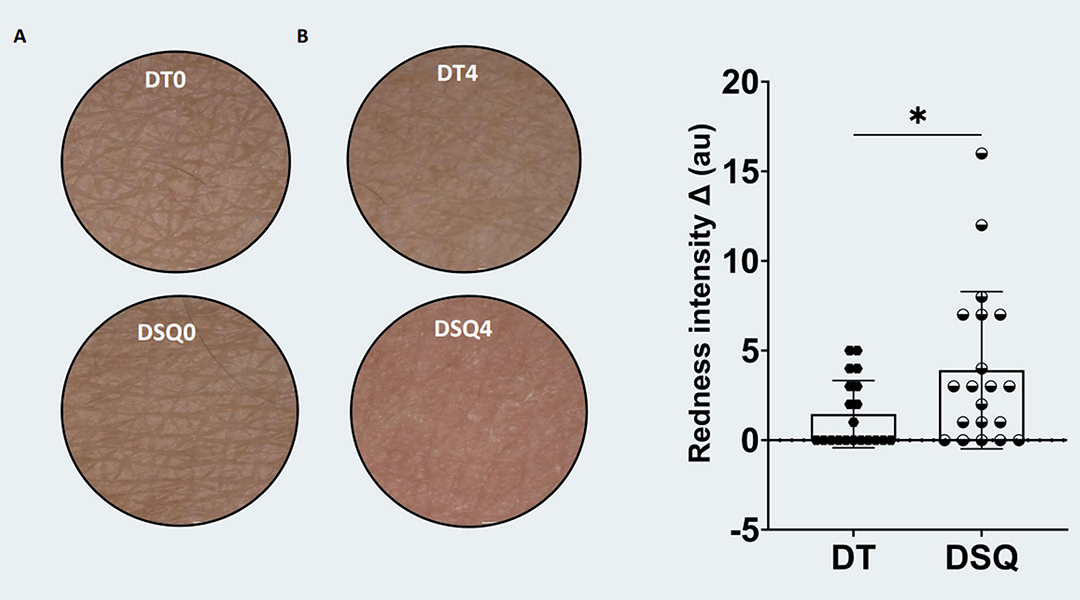
Figure 3. Skin erythema after sampling with four consecutive tapes
A. Images of skin erythema before (DTO, DSQ0) and after sampling with 4 consecutive tapes (DT4, DSQ4). Bar is 1mm.
B. Quantification of skin erythema expressed as a difference in skin redness intensity between the baseline and the 4th tape.
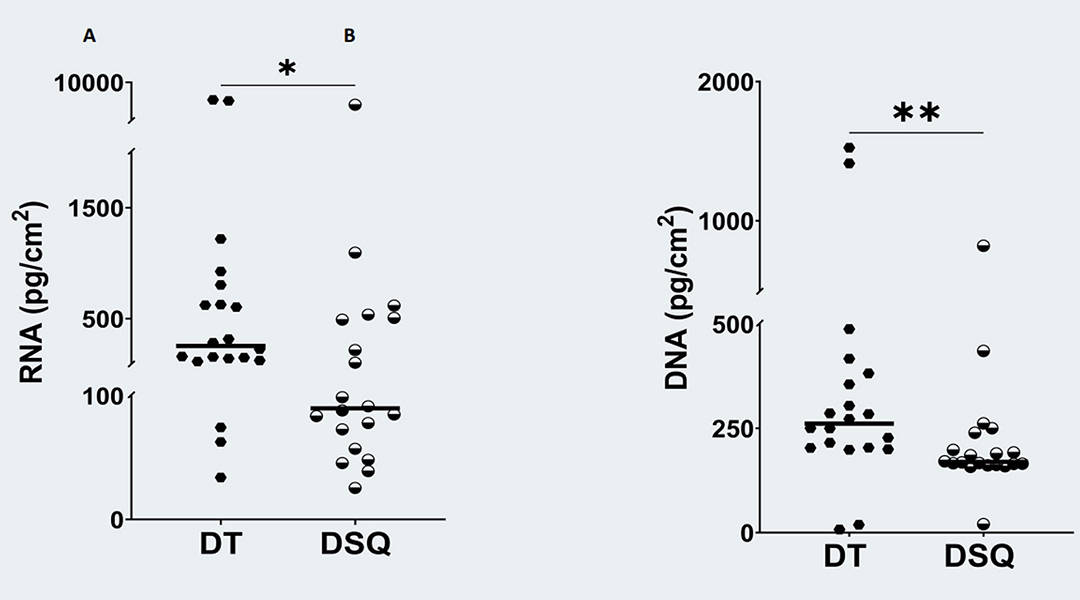
Figure 4. Quantity of nucleic acids extracted from four DT or SQ tapes
A, B. Nucleic acids were extracted from four DT or SQ tapes and quantified using RT-qPCR.
Reference: Non-invasive skin sample collection: Comparing D-squame and the Smart Sticker. DermTech, Inc. European Society for Dermatological Research (ESDR), ESDR 50th Anniversary Virtual Meeting. September 22 – 25, 2021. https://dermtechstratum.com/wp-content/uploads/ESDR2021-Poster-DTvsDSQ-v3.pdf

Send us a message
Click the contact us button and drop us a line. We'll be in touch shortly.
Get In Touch
Partner with Stratum by DermTech 2.0.